Justin N. Wood
How does object recognition emerge in the newborn brain? To address this question, I examined the information content of the first visual object representation built by newly hatched chicks (Gallus gallus). In their first week of life, chicks were raised in controlled-rearing chambers that contained a single virtual object rotating around a single axis. In their second week of life, I tested whether subjects had encoded information about the identity and viewpoint of the virtual object. The results showed that chicks built object representations that contained both object identity information and view-specific information. However, there was a trade-off between these two types of information: subjects who were more sensitive to identity information were less sensitive to view-specific information, and vice versa. This pattern of results is predicted by iterative, hierarchically organized visual processing machinery, the machinery that supports object recognition in adult primates. More generally, this study shows that invariant object recognition is a core cognitive ability that can be operational at the onset of visual object experience.

(a) The four object animations presented during the input phase. Each subject was shown only one of the four animations. The objects moved smoothly, completing a full rotation every 6 seconds. (b) (Top) A schematic showing a 4-hour presentation schedule of the virtual object during the input phase. (Bottom) A schematic showing a 4-hour presentation schedule of the virtual objects during the test phase.
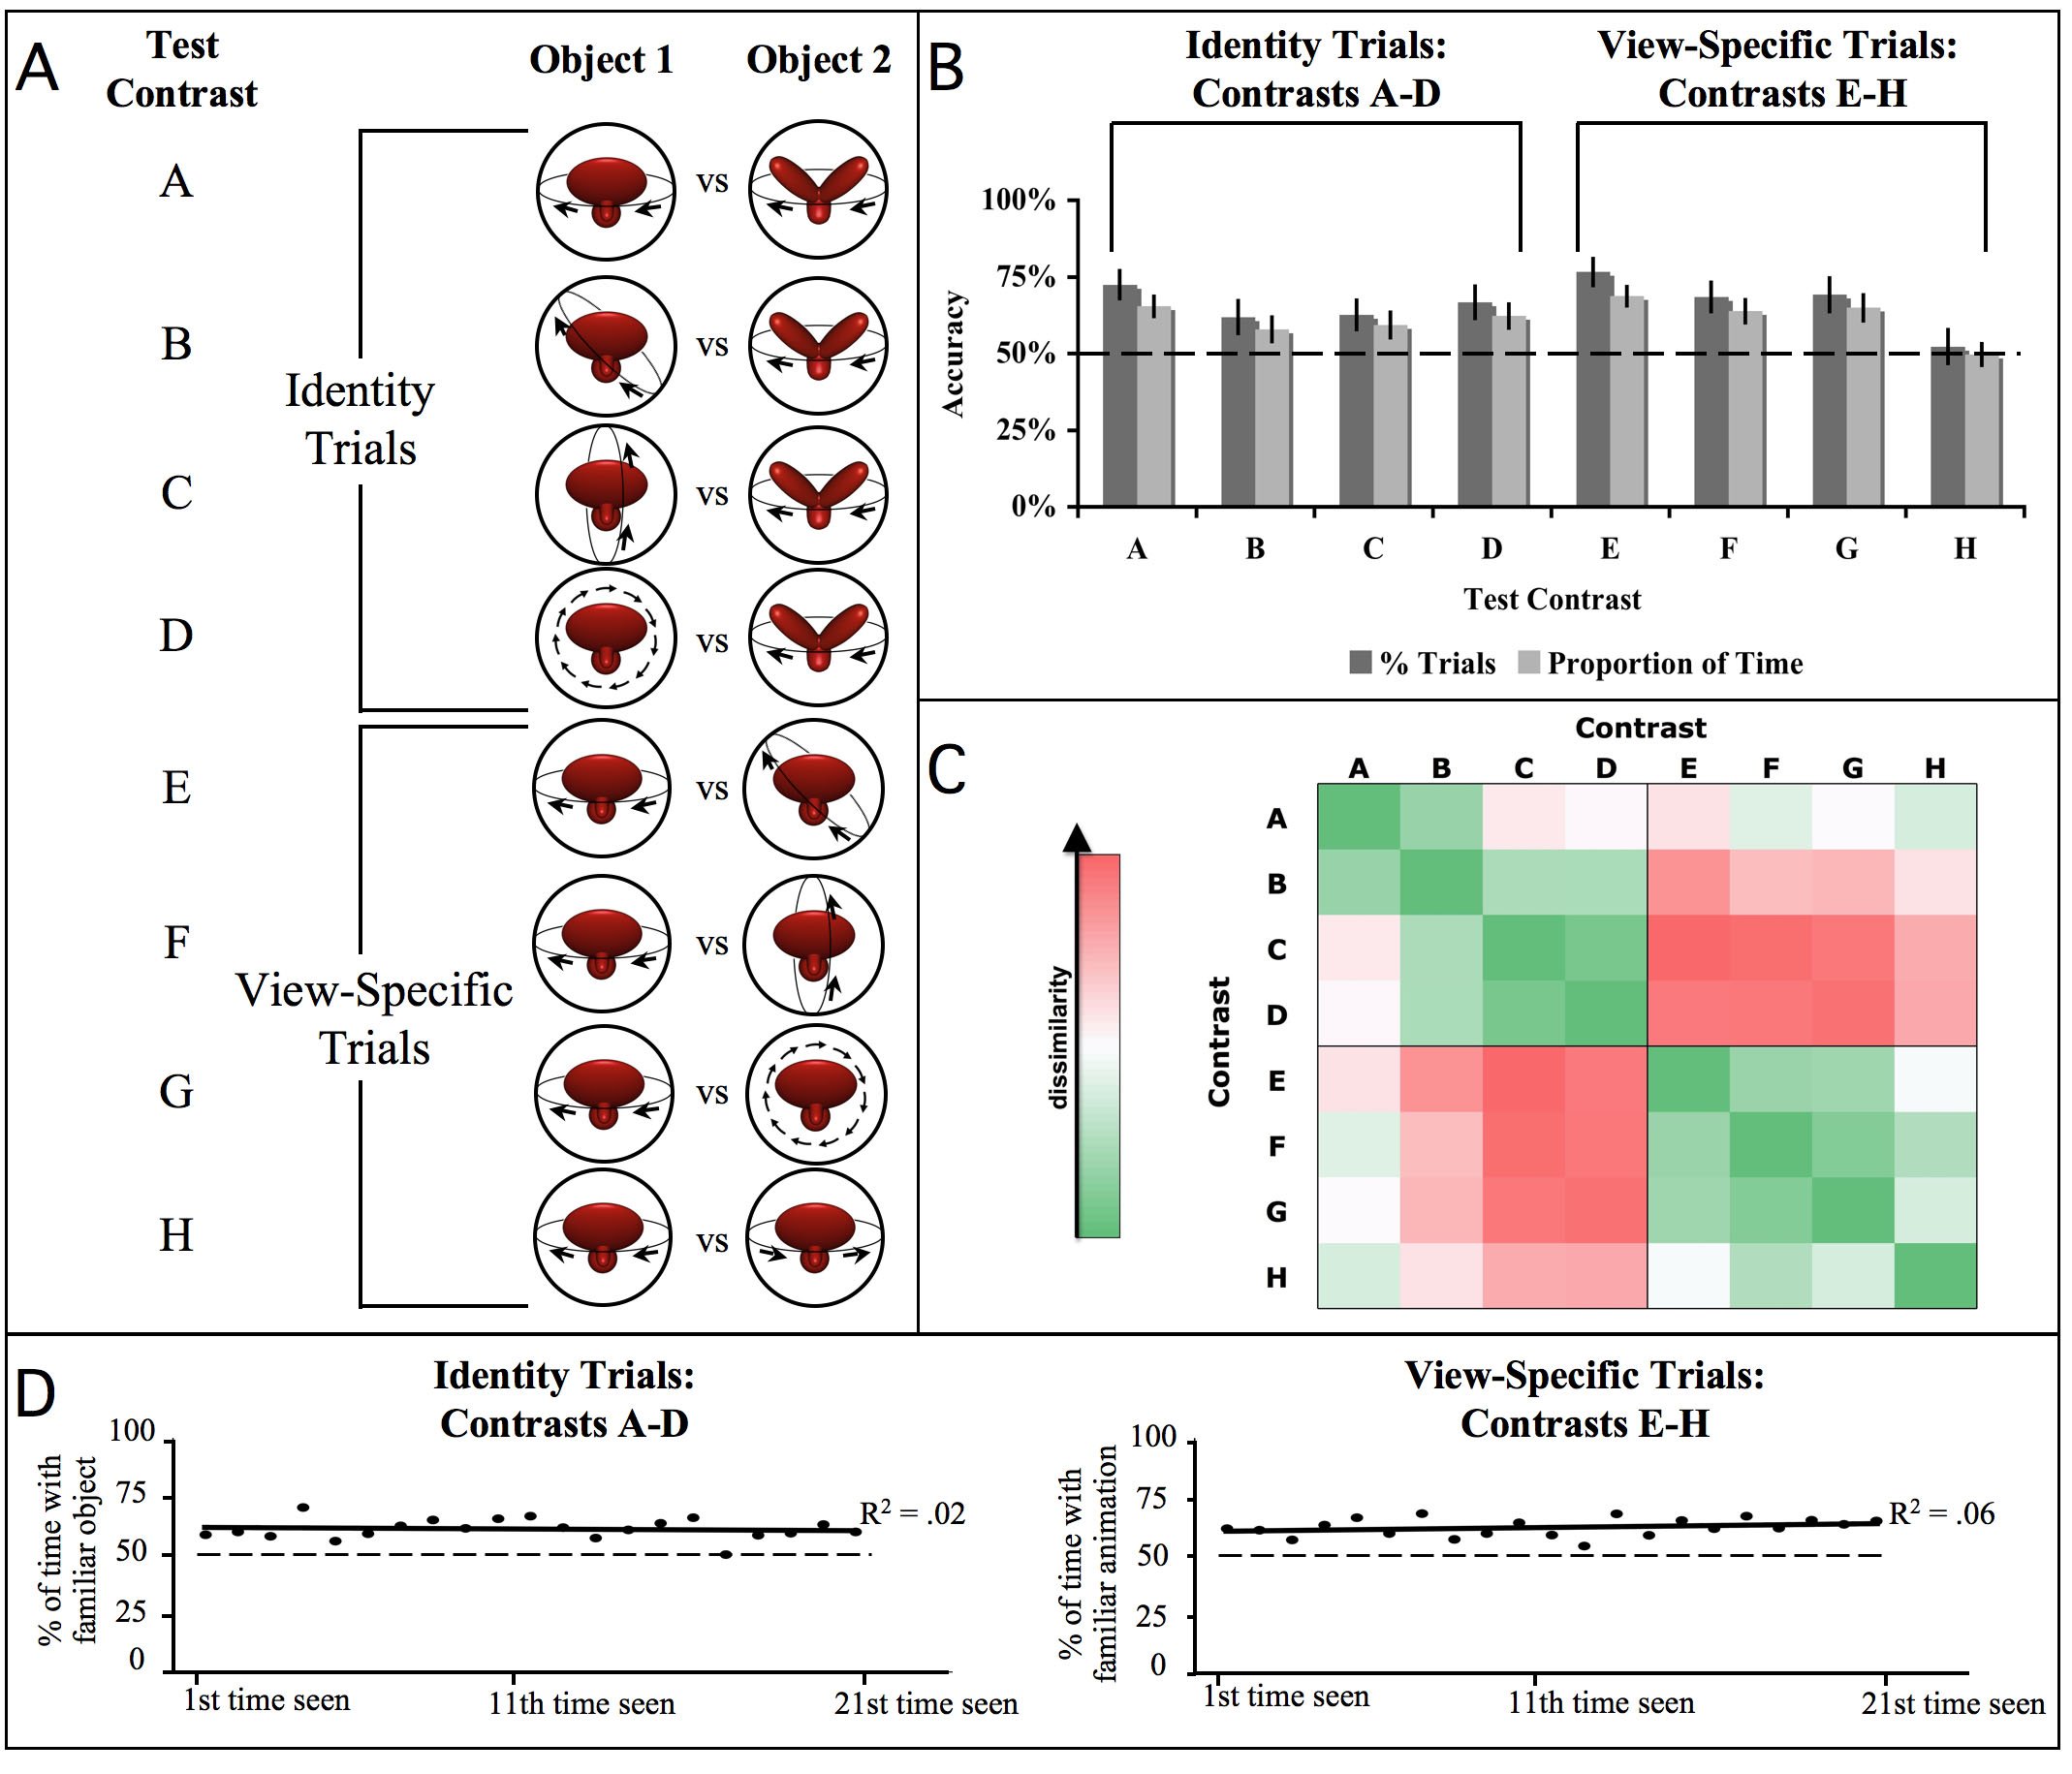
(a) The eight test contrasts presented during the test phase. The specific object animations depicted here were presented to the subjects who were imprinted to the first animation shown in Figure 1a. (b) Subjects’ mean performance on the eight test contrasts. The dark gray bars denote the percentage of correct trials, and the light gray bars denote the proportion of time subjects spent with the familiar object on the Identity Trials and the familiar animation on the View-Specific Trials. Chance performance was 50%. Error bars denote standard error. (c) The representational dissimilarity matrix. Each cell of the matrix compares the behavioral response elicited by two test contrasts. Low dissimilarities (green colors) indicate that subjects exhibited similar behavior when presented with those test contrasts. High dissimilarities (red colors) indicate that subjects exhibited the opposite behavior when presented with those test contrasts. The dissimilarity between two test contrasts was measured as 1 minus the Pearson correlation between the set of performance values obtained across all subjects for the two different contrasts. The color scale reflects the full range of correlation values. (d) Change over time results. The graphs illustrate group mean performance for the Identity Trials and View-Specific Trials, computed for the first, second, third, etc., presentation of the test contrasts. The y-axis indicates the proportion of time subjects spent with the familiar object on the Identity Trials and the familiar animation on the View-Specific Trials. Chance performance was 50%.

The abstraction space. Each dot depicts the object representation built by one subject. The y-axis reflects the representation’s sensitivity to identity information (measured from Contrasts A–D) and the x-axis reflects the representation’s sensitivity to view-specific information (measured from Contrasts E–H). The abstraction space shown on the left includes the representations built by all of the subjects, whereas the smaller abstraction spaces shown on the right include the representations built by the subjects who were imprinted to each of the two objects.