Samantha M. W. Wood, Scott P. Johnson, and Justin N. Wood
What mechanisms underlie learning in newborn brains? Recently, researchers reported that newborn chicks use unsupervised statistical learning to encode the transitional probabilities (TPs) of shapes in a sequence, suggesting that TP-based statistical learning can be present in newborn brains. Using a preregistered design, we attempted to reproduce this finding with an automated method that eliminated experimenter bias and allowed more than 250 times more data to be collected per chick. With precise measurements of each chick’s behavior, we were able to perform individual-level analyses and substantially reduce measurement error for the group-level analyses. We found no evidence that newborn chicks encode the TPs between sequentially presented shapes. None of the chicks showed evidence for this ability. Conversely, we obtained strong evidence that newborn chicks encode the shapes of individual objects, showing that this automated method can produce robust results. These findings challenge the claim that TP-based statistical learning is present in newborn brains.
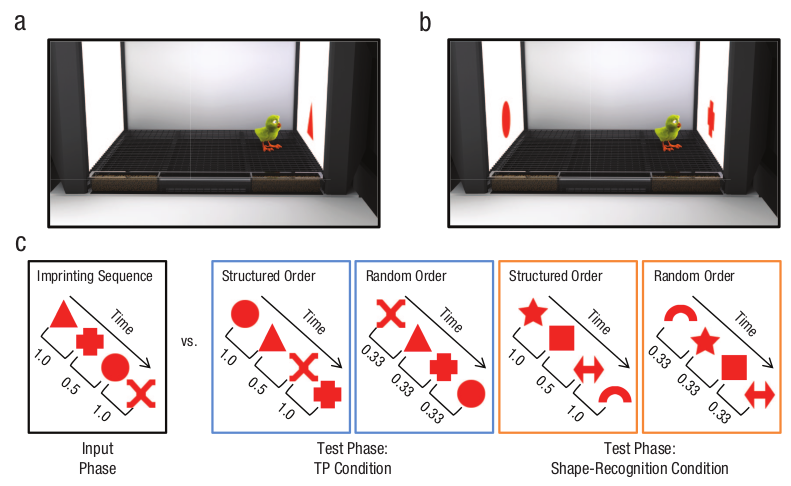
Experiment 1 method. The illustrations in the top row show a controlled-rearing chamber (a) during the input phase and (b) during the test phase. The stimuli design (c) is shown in the bottom row. During the input phase, an imprinting sequence defined by the transitional probabilities (TPs) within and between shape pairs appeared on one display wall at a time. The imprinting sequence is shown in the box with the black border (c). During the test phase, we presented chicks with two-alternative forced-choice tasks. In each test trial, one display wall showed the imprinting sequence (c, box with black border), and the other display wall showed one of four novel sequences (c, boxes with blue and orange borders). In the TP condition (c, boxes with blue borders), chicks saw the same shapes as in the imprinting sequence, but in novel orders. In the shape-recognition condition (c, boxes with orange borders), the shapes were novel. In each condition, the novel sequence was presented in either a structured order or a random order. Numbers in (c) show the probability of transitioning from one shape to the next.

A comparison of the measurement error and effect size obtained in the present study and the original Santolin, Rosa-Salva, Vallor- tigara, and Regolin (2016) study. The gray bars show the (a) measurement error (standard deviation) and (b) effect size (Cohen’s d) from the two experiments by Santolin et al. The orange and blue lines show the measurement error and effect size from the shape-recognition and transitional-probability conditions in the present study.
Movie 1. Initial phase with ordered stimulus
Movie 1. Initial phase with ordered stimulus
Movie 3. Testing phase with distractor stimulus